
How big are typical company-event groups, what budgets do organizers report, and how far ahead do they book? Event Captain analyzed survey responses from 2,232 people who confirmed that they plan or book events for their company or organization.
The survey began with an eligibility question about that planning or booking role. Event Captain confirms that only people answering Yes could continue. Responses without a usable affirmative answer, or with contradictory Yes/No answers, are excluded from the findings.
Self-selected survey respondents; some were offered a thank-you incentive. Results are unweighted, and no response rate is reported. Each statistic uses its own answered base. All budget figures are in US dollars (USD).
Three findings at a glance#
Small groups are common in this sample, just over half of budget answers fall in bands capped at $50 USD or less, and one to three months is the most frequently selected booking window. The comparisons later in the report explore how priorities differ by group size, package selection and the event types respondents organize.
2026 edition, version 2026.2. Responses were collected during 2026; analysis completed November 14, 2026.
How large are the groups company-event organizers typically plan for?#
Some survey versions used overlapping attendance ranges, including 20–40 and 21–50. The downloadable tables retain those original labels so the full distribution can be inspected without forcing them into incompatible categories.
For restaurants and venues, the finding supports making small-team options easy to find: show the minimum group size, what the package includes, and how an organizer can request a date. The survey did not measure whether introducing such a package increases bookings.
What budgets do organizers report per person?#
All monetary amounts are USD. These are reported budget ranges, not actual event spending. The question does not establish whether taxes, gratuities or service charges were included.
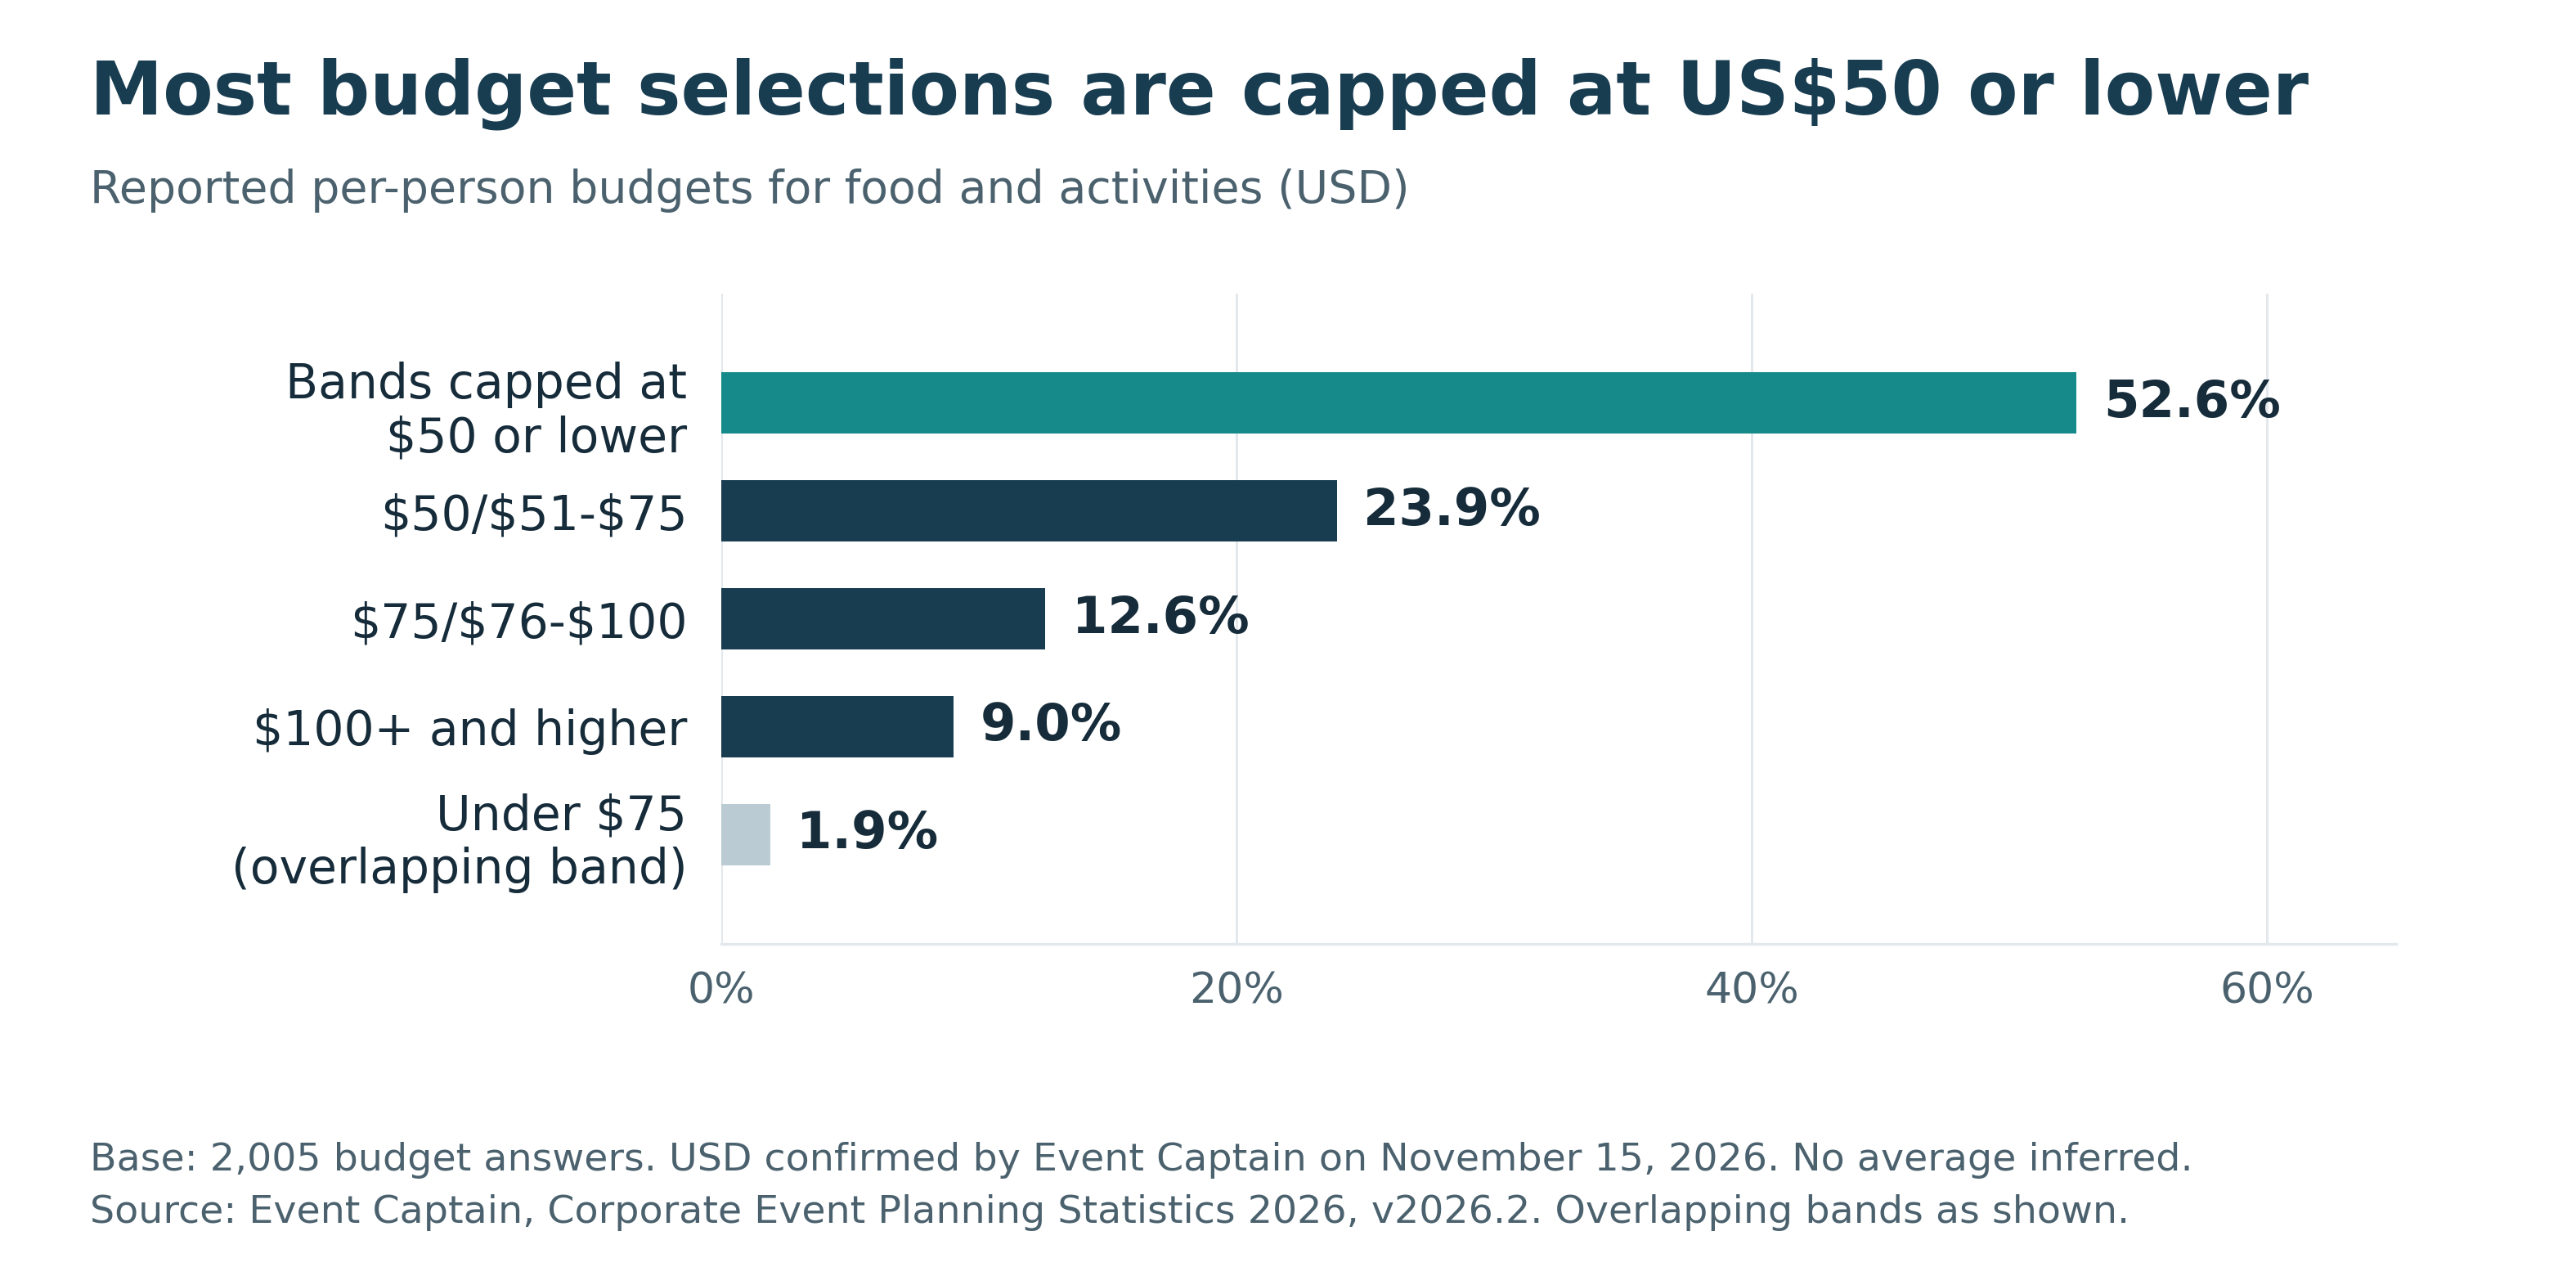
Base: 2,005. All amounts are USD. The overlapping “Under $75” response is kept separate.
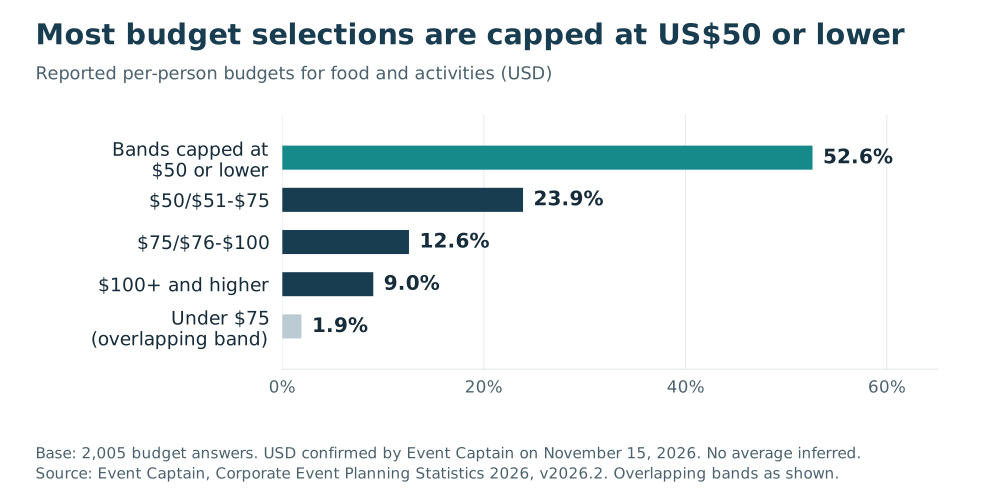
Source: Event Captain, Corporate Event Planning Statistics 2026, version 2026.2 · All monetary amounts in USD
Exact counts and answered bases are retained in the supporting CSV.
| Reported budget bands in USD | Count | Share |
|---|---|---|
| Bands capped at $50 or less | 1,055 | 52.6% |
| $50–75 or $51–75 bands | 479 | 23.9% |
| $75–100 or $76–100 bands | 252 | 12.6% |
| $100+ or higher bands | 181 | 9.0% |
| Under $75 overlapping band | 38 | 1.9% |
Bands capped at $50 or less combine Under $50, Less than $30 per person, $31–50 per person and $30–50 per person. All amounts are USD.
The open-ended and overlapping ranges do not support an exact average budget. The results provide a reference for qualifying inquiries: ask for the organizer’s per-person budget and make the package inclusions clear. A venue should also account for its own costs, service model and local market when setting prices.
How far ahead do organizers secure event bookings?#
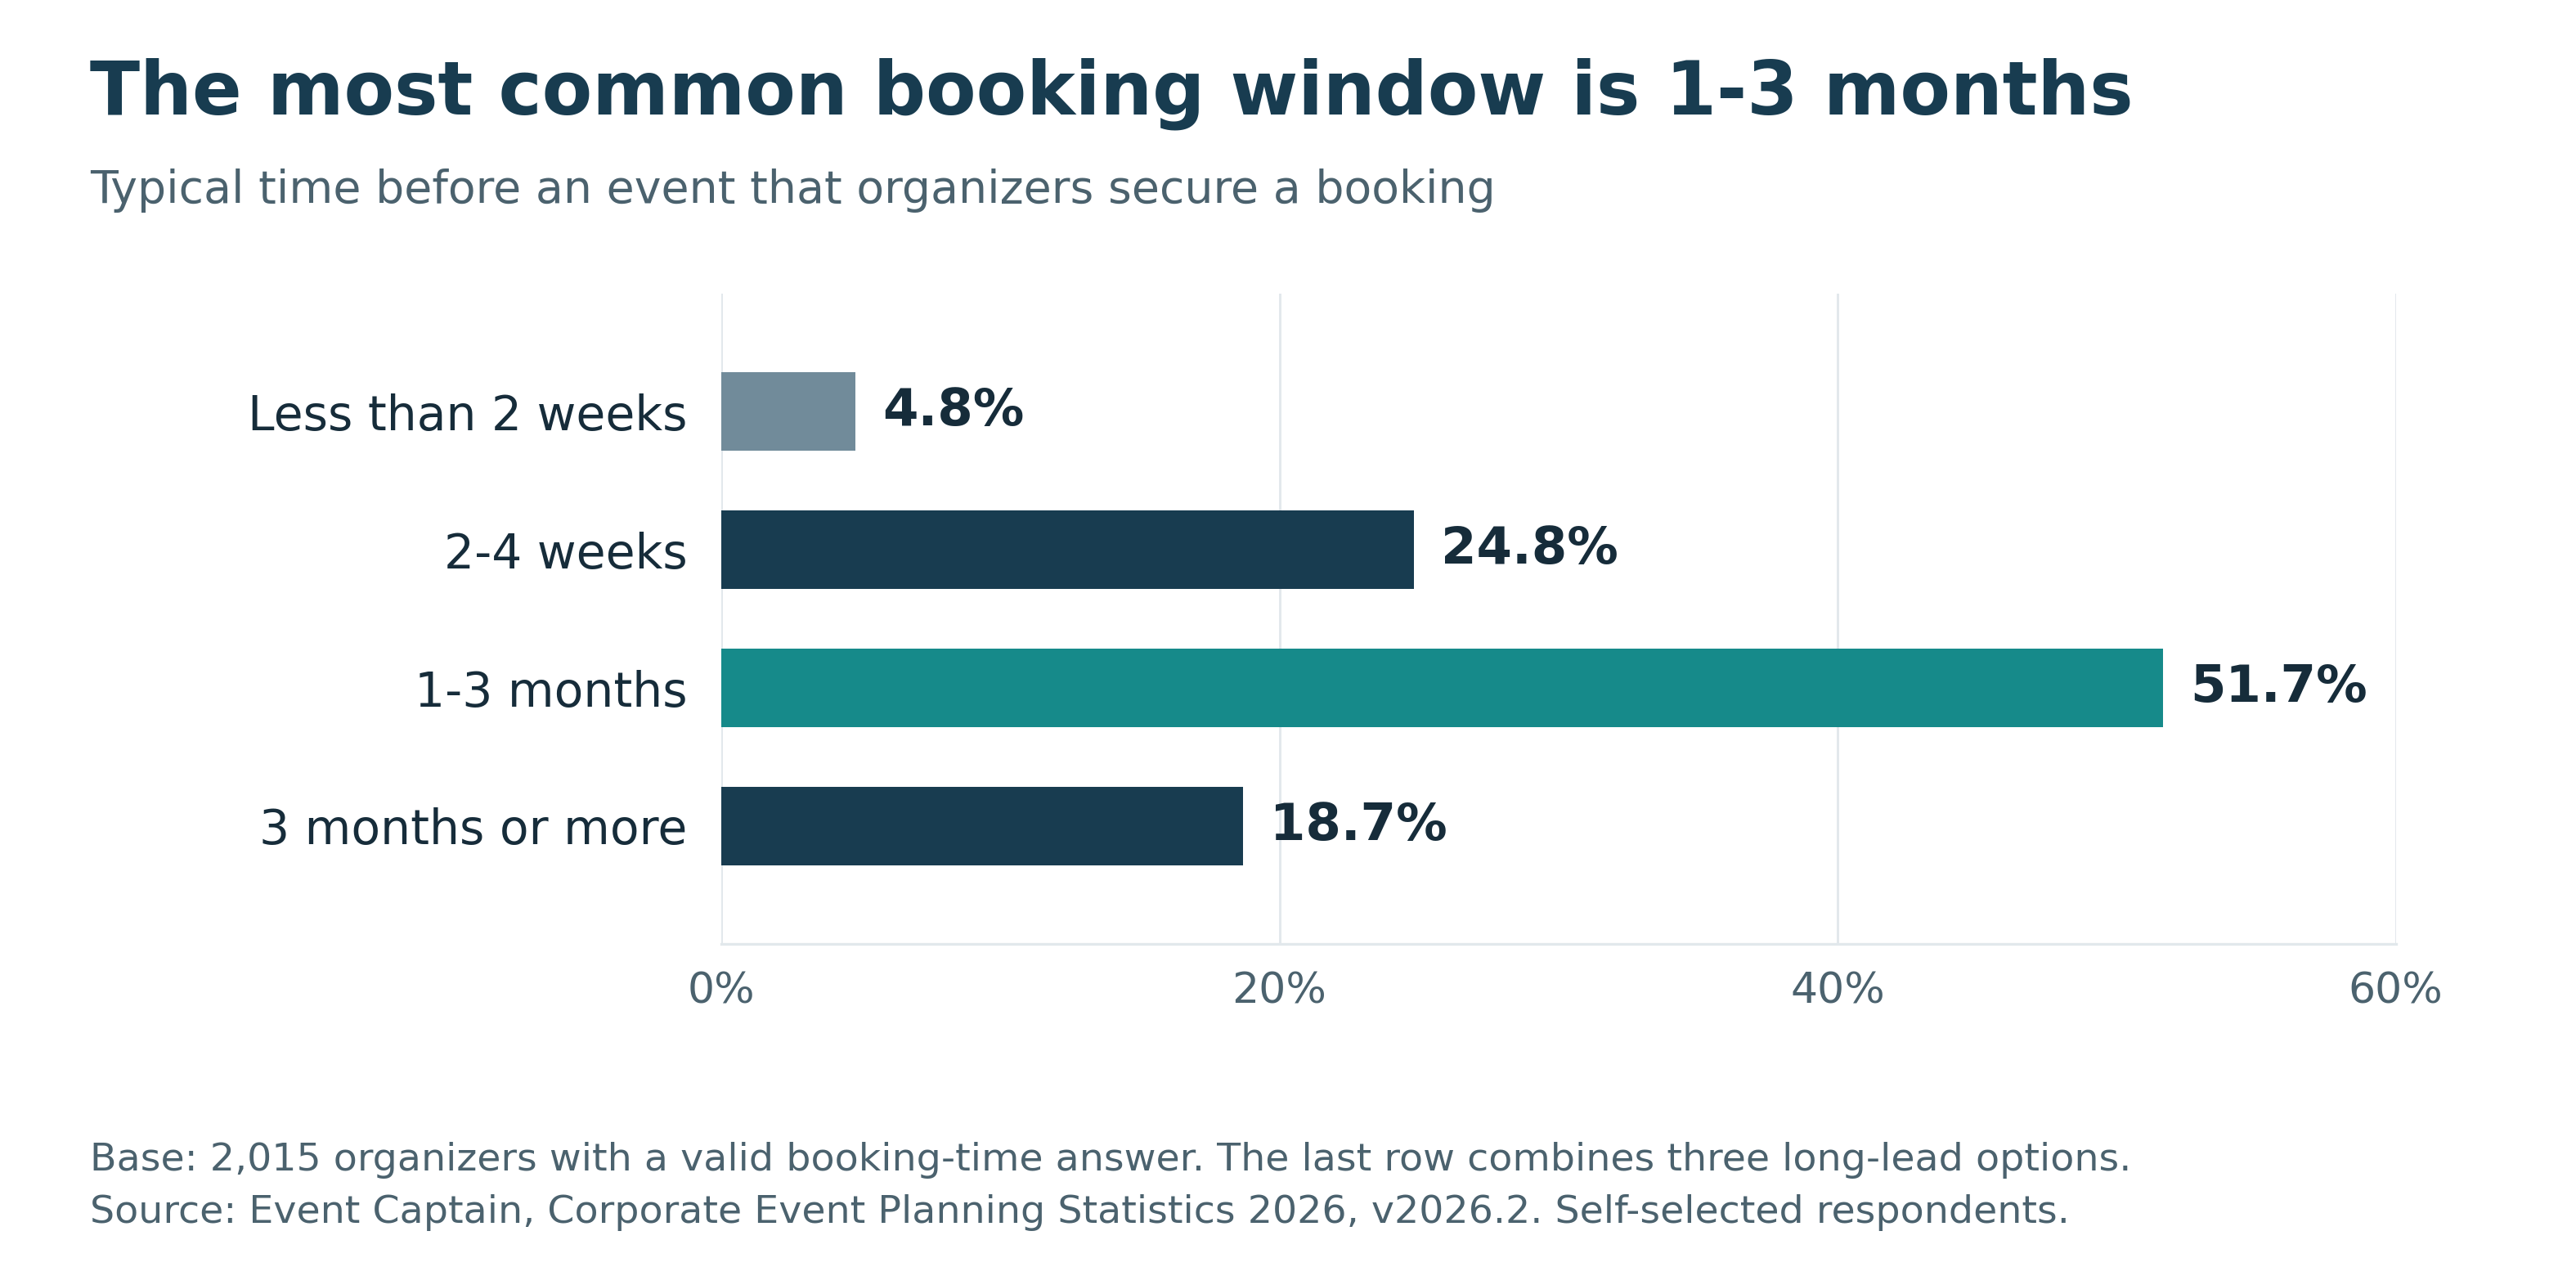
Base: 2,015. “3 months or more” combines 3+ months, 3–6 months and 6+ months. Original labels are retained in the data download. These are reported habits, not observed contract dates.
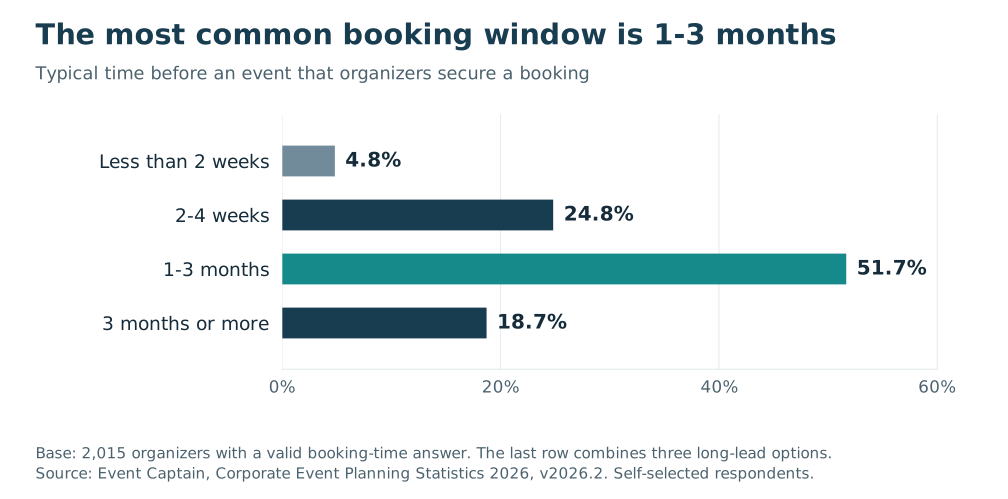
Source: Event Captain, Corporate Event Planning Statistics 2026, version 2026.2.
Exact counts and answered bases are retained in the supporting CSV.
| Reported booking lead time | Count | Share |
|---|---|---|
| Less than 2 weeks | 97 | 4.8% |
| 2–4 weeks | 500 | 24.8% |
| 1–3 months | 1,041 | 51.7% |
| 3 months or more combined | 377 | 18.7% |
Question: “How far in advance do you typically secure a booking for these events?” The original 1–3 months and 3+ months labels share a boundary at three months.
Together, 29.6% selected a booking window of four weeks or less. Venues therefore have both a substantial planning window and a shorter-notice segment to serve. An outreach calendar can address the earlier planning window while the booking process makes near-term availability easy to check.
What matters when organizers choose an event venue?#
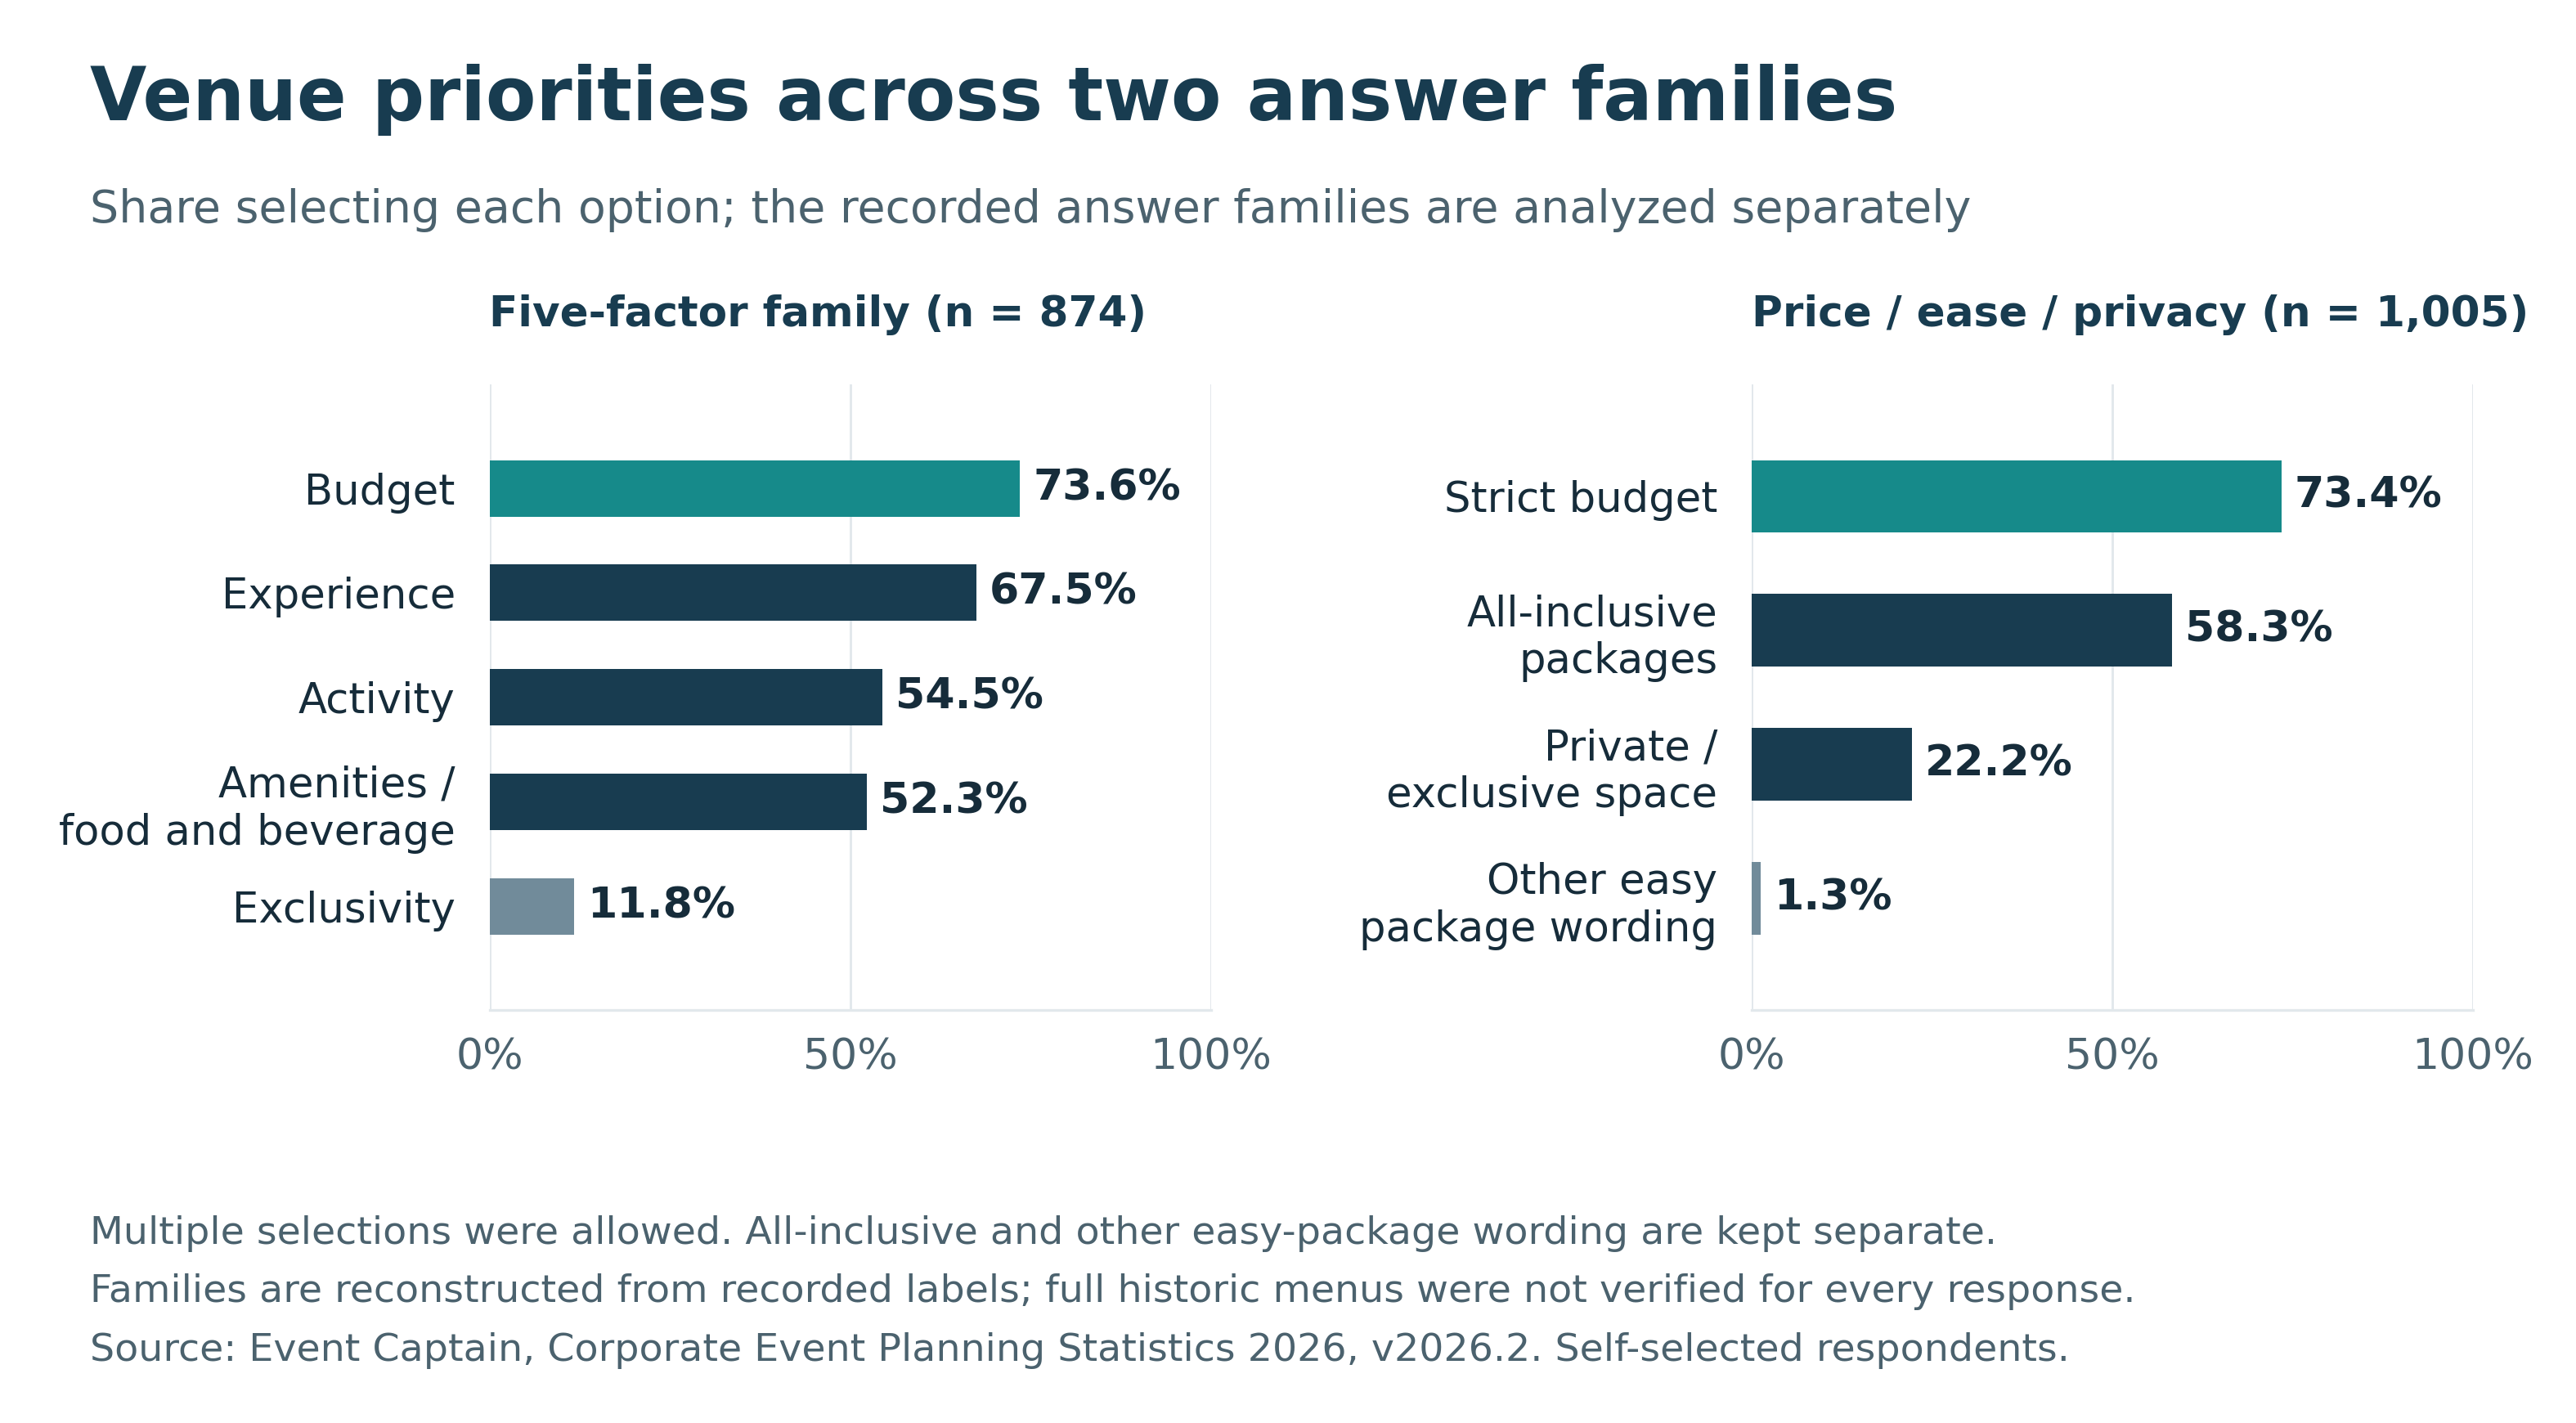
Five-factor family: n = 874. Price, ease and privacy family: n = 1,005. Multiple selections allowed. Similar answer options were grouped for reporting.
Source: Event Captain, Corporate Event Planning Statistics 2026, version 2026.2.
Exact counts and answered bases are retained in the supporting CSV.
| Five-factor answer family | Selected | Share |
|---|---|---|
| Budget | 643 of 874 | 73.6% |
| Experience | 590 of 874 | 67.5% |
| Activity | 476 of 874 | 54.5% |
| Amenities/Food & Bev | 457 of 874 | 52.3% |
| Exclusivity | 103 of 874 | 11.8% |
Question: “Which factor(s) matters MOST when booking an event for your group?” Multiple selections allowed.
A second answer family described price, ease and privacy more explicitly. In that group, 58.3% selected “Ease: All-inclusive packages (Food + Drink + Activities handled together)” and 73.4% selected fitting into a strict budget. The all-inclusive result is 586 of 1,005 respondents.
These results support presenting a concrete experience alongside transparent pricing. The survey does not show that organizers value only the lowest price, nor does it establish a willingness-to-pay premium for any one feature.
When do organizers book event venues?#
| Likely venue-booking period | Count | Share |
|---|---|---|
| Q1 January–March | 563 | 25.4% |
| Q2 April–June | 605 | 27.3% |
| Q3 July–September | 825 | 37.2% |
| Q4 October–December | 1,102 | 49.8% |
Question: “Which months are you most likely to book a venue? (Select all that apply)” Base: 2,215. Percentages exceed 100% because multiple selections were allowed.
The question measures when people book a venue. It does not measure the quarter when their events take place or when revenue is earned. It also does not establish that Q4 bookings are all for holiday parties.
How planning preferences differ between organizers#
The following comparisons are exploratory associations among respondents with compatible recorded answers. They describe differences between groups; they do not show that a package, group size or event type causes a particular outcome. The relevant bases and questionnaire limitations accompany each finding.
How do privacy and booking timing differ by group size?#
Privacy was selected by 45.6% of respondents in clearly defined 51+ attendance bands (47 of 103), compared with 15.8% of those selecting 1–20 people (93 of 590). The privacy option includes a private section or the whole venue.
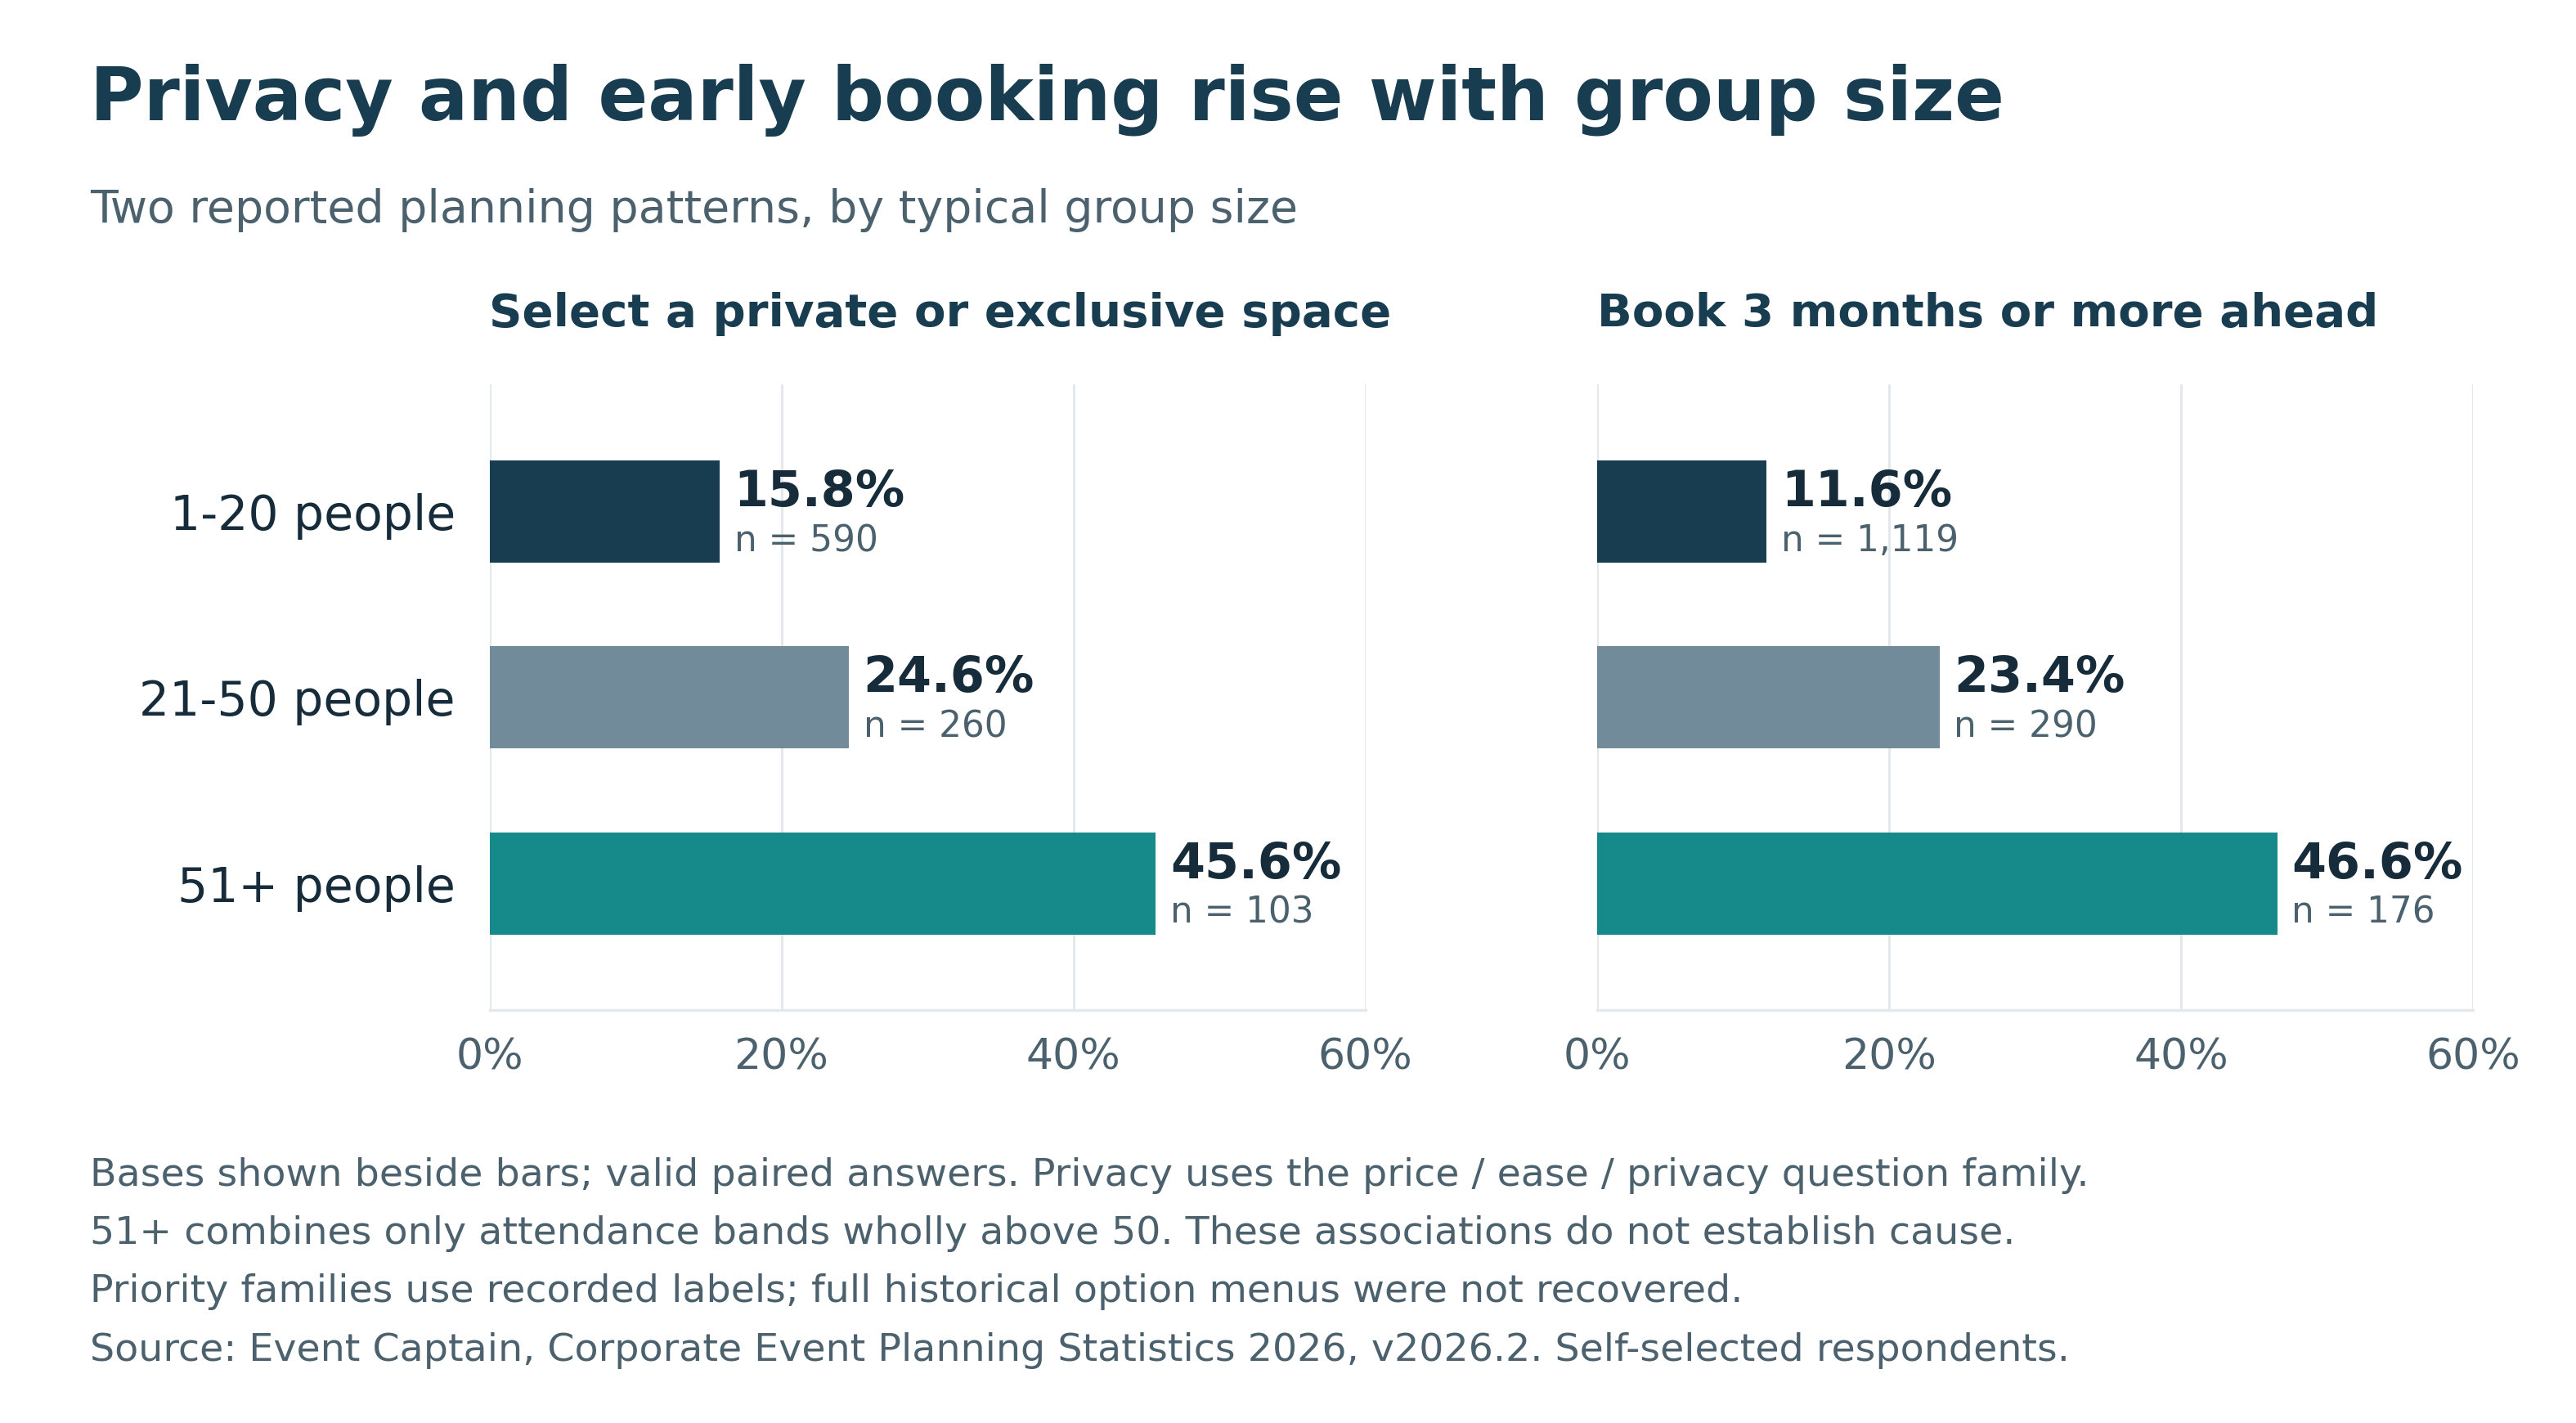
Each panel has a separate answered base. Privacy: n = 590, 260 and 103. Booking 3+ months ahead: n = 1,119, 290 and 176. The 51+ group combines only attendance bands wholly above 50.

Source: Event Captain, Corporate Event Planning Statistics 2026, version 2026.2.
Supporting CSV includes full_confirmed and additional comparison cohorts.
| Typical attendance group | Private space selected | 3 months or more ahead |
|---|---|---|
| 1–20 people | 93/590 · 15.8% | 130/1,119 · 11.6% |
| 21–50 people | 64/260 · 24.6% | 68/290 · 23.4% |
| Clearly 51+ people | 47/103 · 45.6% | 82/176 · 46.6% |
Privacy wording includes either the entire venue or a private section. It does not require a full buyout. Overlapping attendance bands are excluded from this three-group comparison.
The timing difference is also substantial: 46.6% of the larger-group respondents selected a booking window of three months or more, compared with 11.6% of small-group respondents. Meanwhile, 37.5% of small-group respondents selected four weeks or less, compared with 11.4% of the clearly 51+ group.
For venues, group size is a useful starting point for the sales conversation. Smaller-group inquiries may benefit from a straightforward package and quick availability check. Larger-group inquiries warrant an earlier conversation about space, layout and exclusive use. These are descriptive relationships; group size alone does not establish what any particular organizer will choose.
How does all-inclusive package selection relate to reported budgets?#
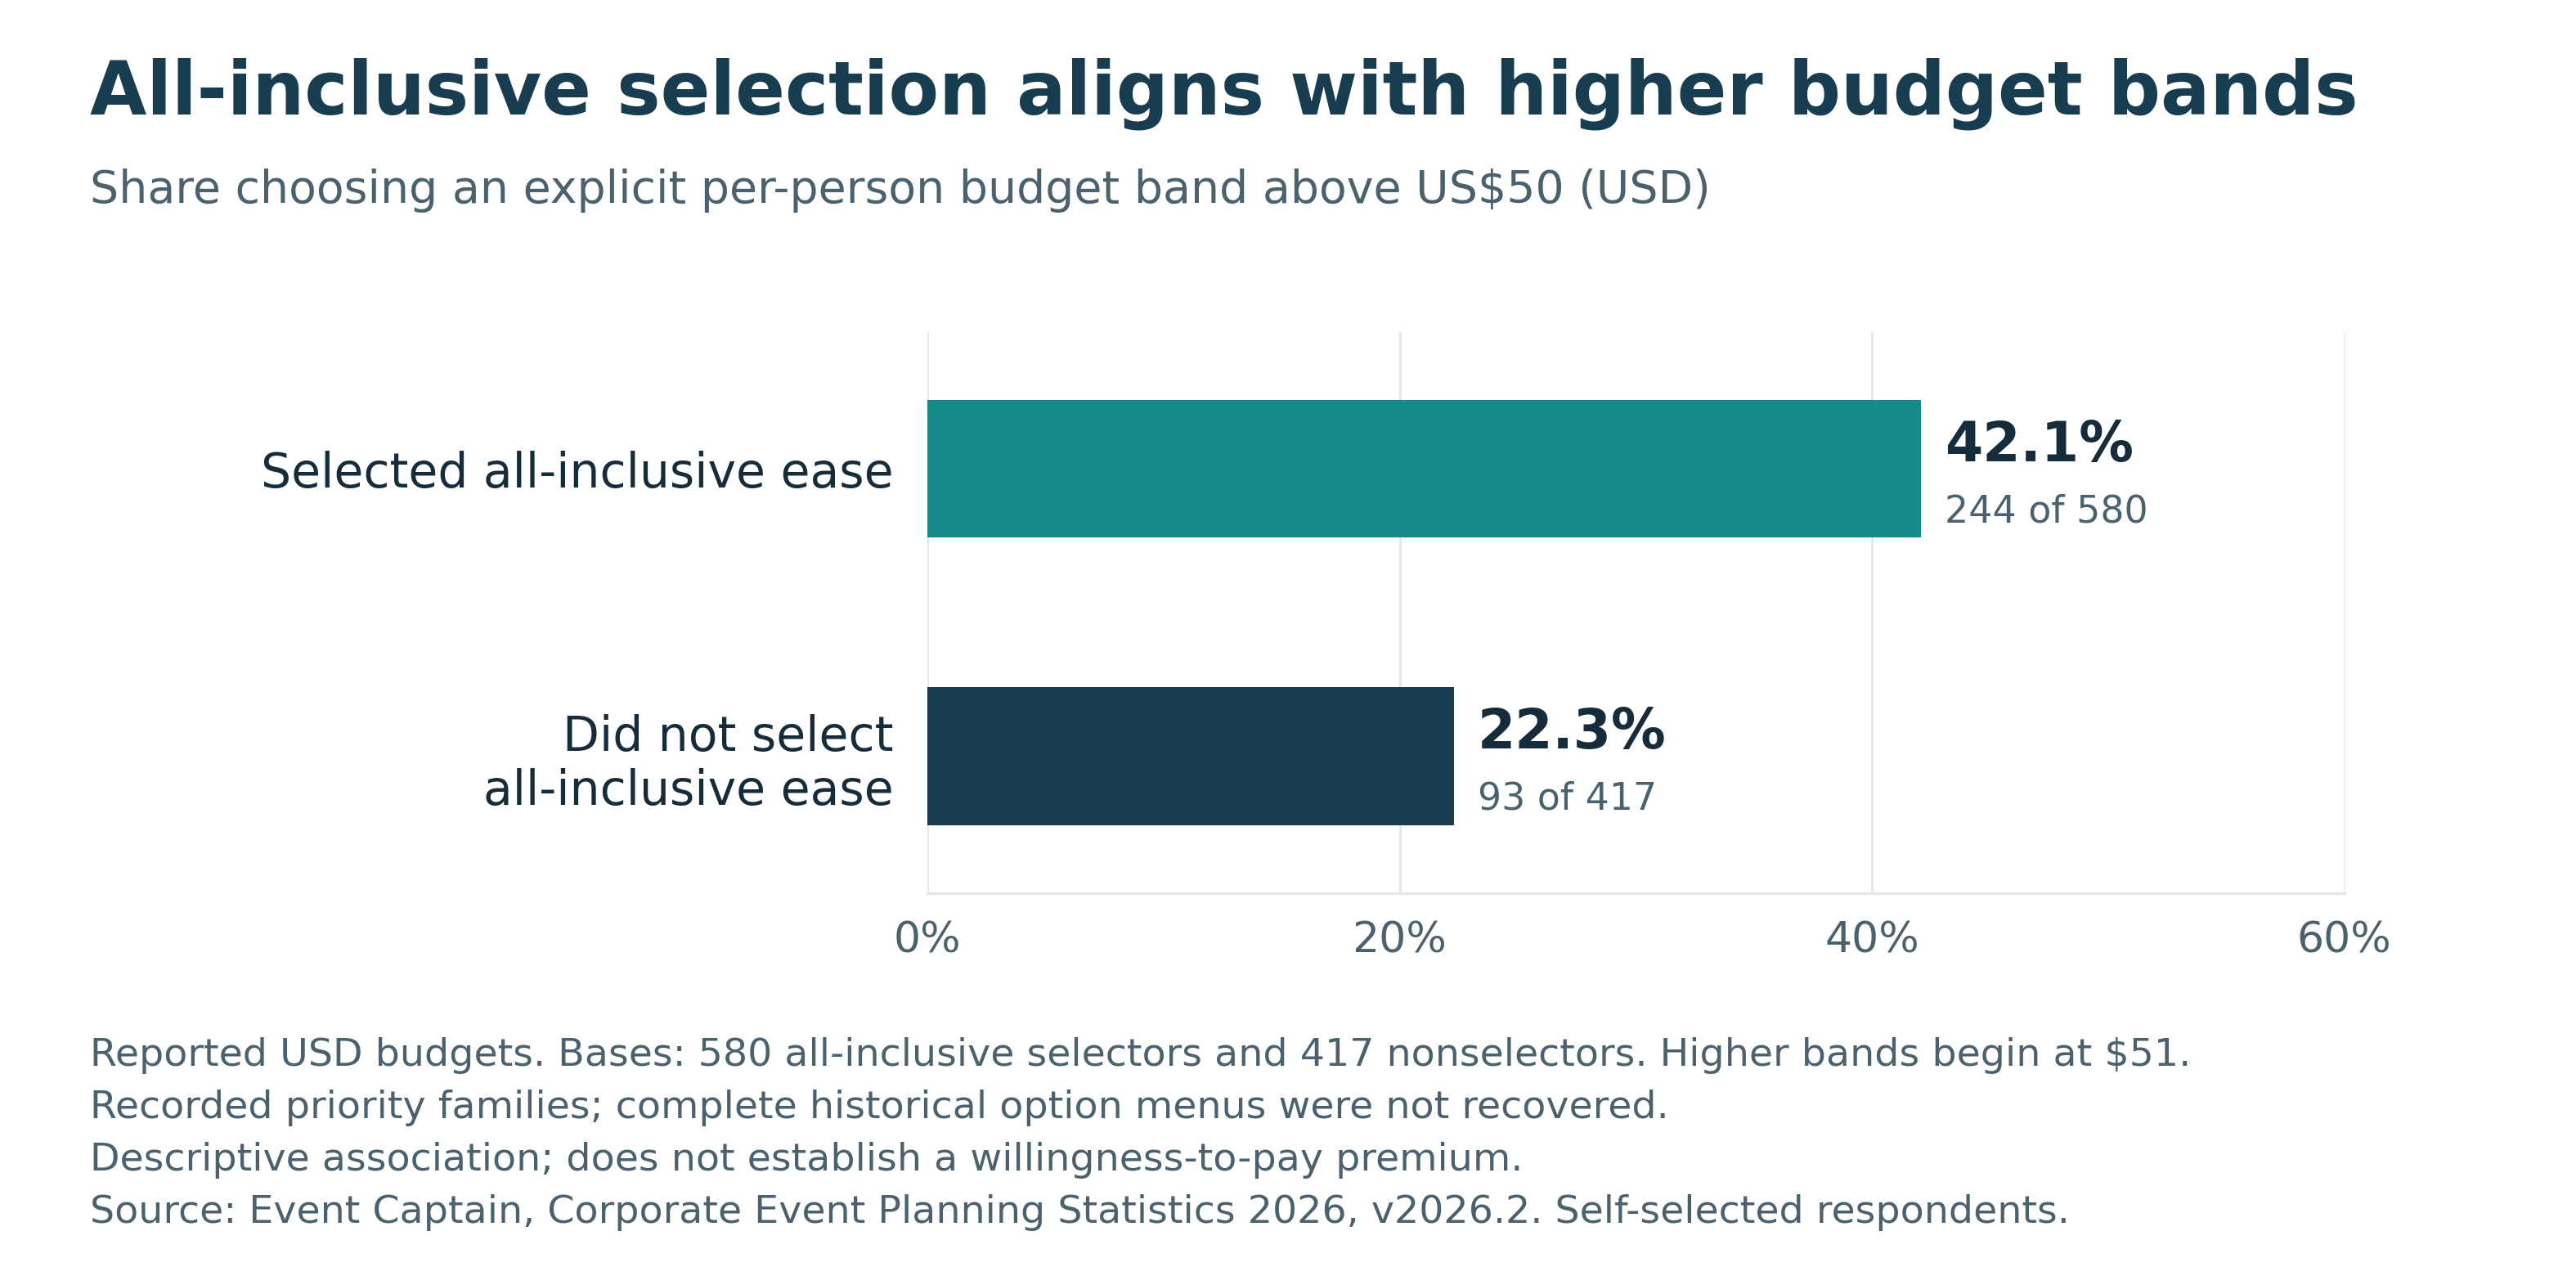
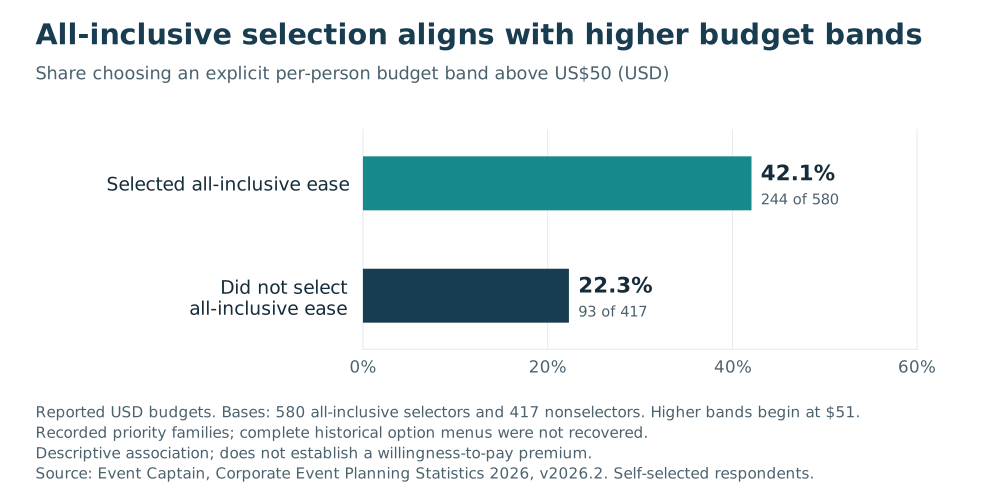
Matching explicit per-person budget format. All-inclusive selected: 244/580 in the higher bands. Not selected: 93/417. All amounts are USD; original budget-band boundaries are preserved. The priority groups combine similar answer options.
Source: Event Captain, Corporate Event Planning Statistics 2026, version 2026.2 · All monetary amounts in USD
Supporting CSV includes full_confirmed and additional comparison cohorts.
| All-inclusive package preference | Selected $51–75, $76–100 or $100+ USD bands | Share |
|---|---|---|
| Selected all-inclusive packages | 244 of 580 | 42.1% |
| Did not select all-inclusive packages | 93 of 417 | 22.3% |
All amounts are USD. This comparison uses matched explicit per-person labels and is not an estimate of actual spending or an experiment on package pricing.
The direction also appears within the exact 1–20-person attendance group: 42.3% of all-inclusive selectors chose the higher budget bands (135 of 319), compared with 20.4% of nonselectors (54 of 265). The supplemental package-budget table provides this size-restricted check. The direction also persists when Q4 venue-booking respondents are excluded.
This is a useful hypothesis for presenting offers: asking whether an organizer wants food, drink and activities coordinated together can help tailor the package discussion. The association does not show that bundling itself increases willingness to spend. It describes the USD budget ranges selected by these organizer groups.
Do client-event organizers emphasize experience more often?#
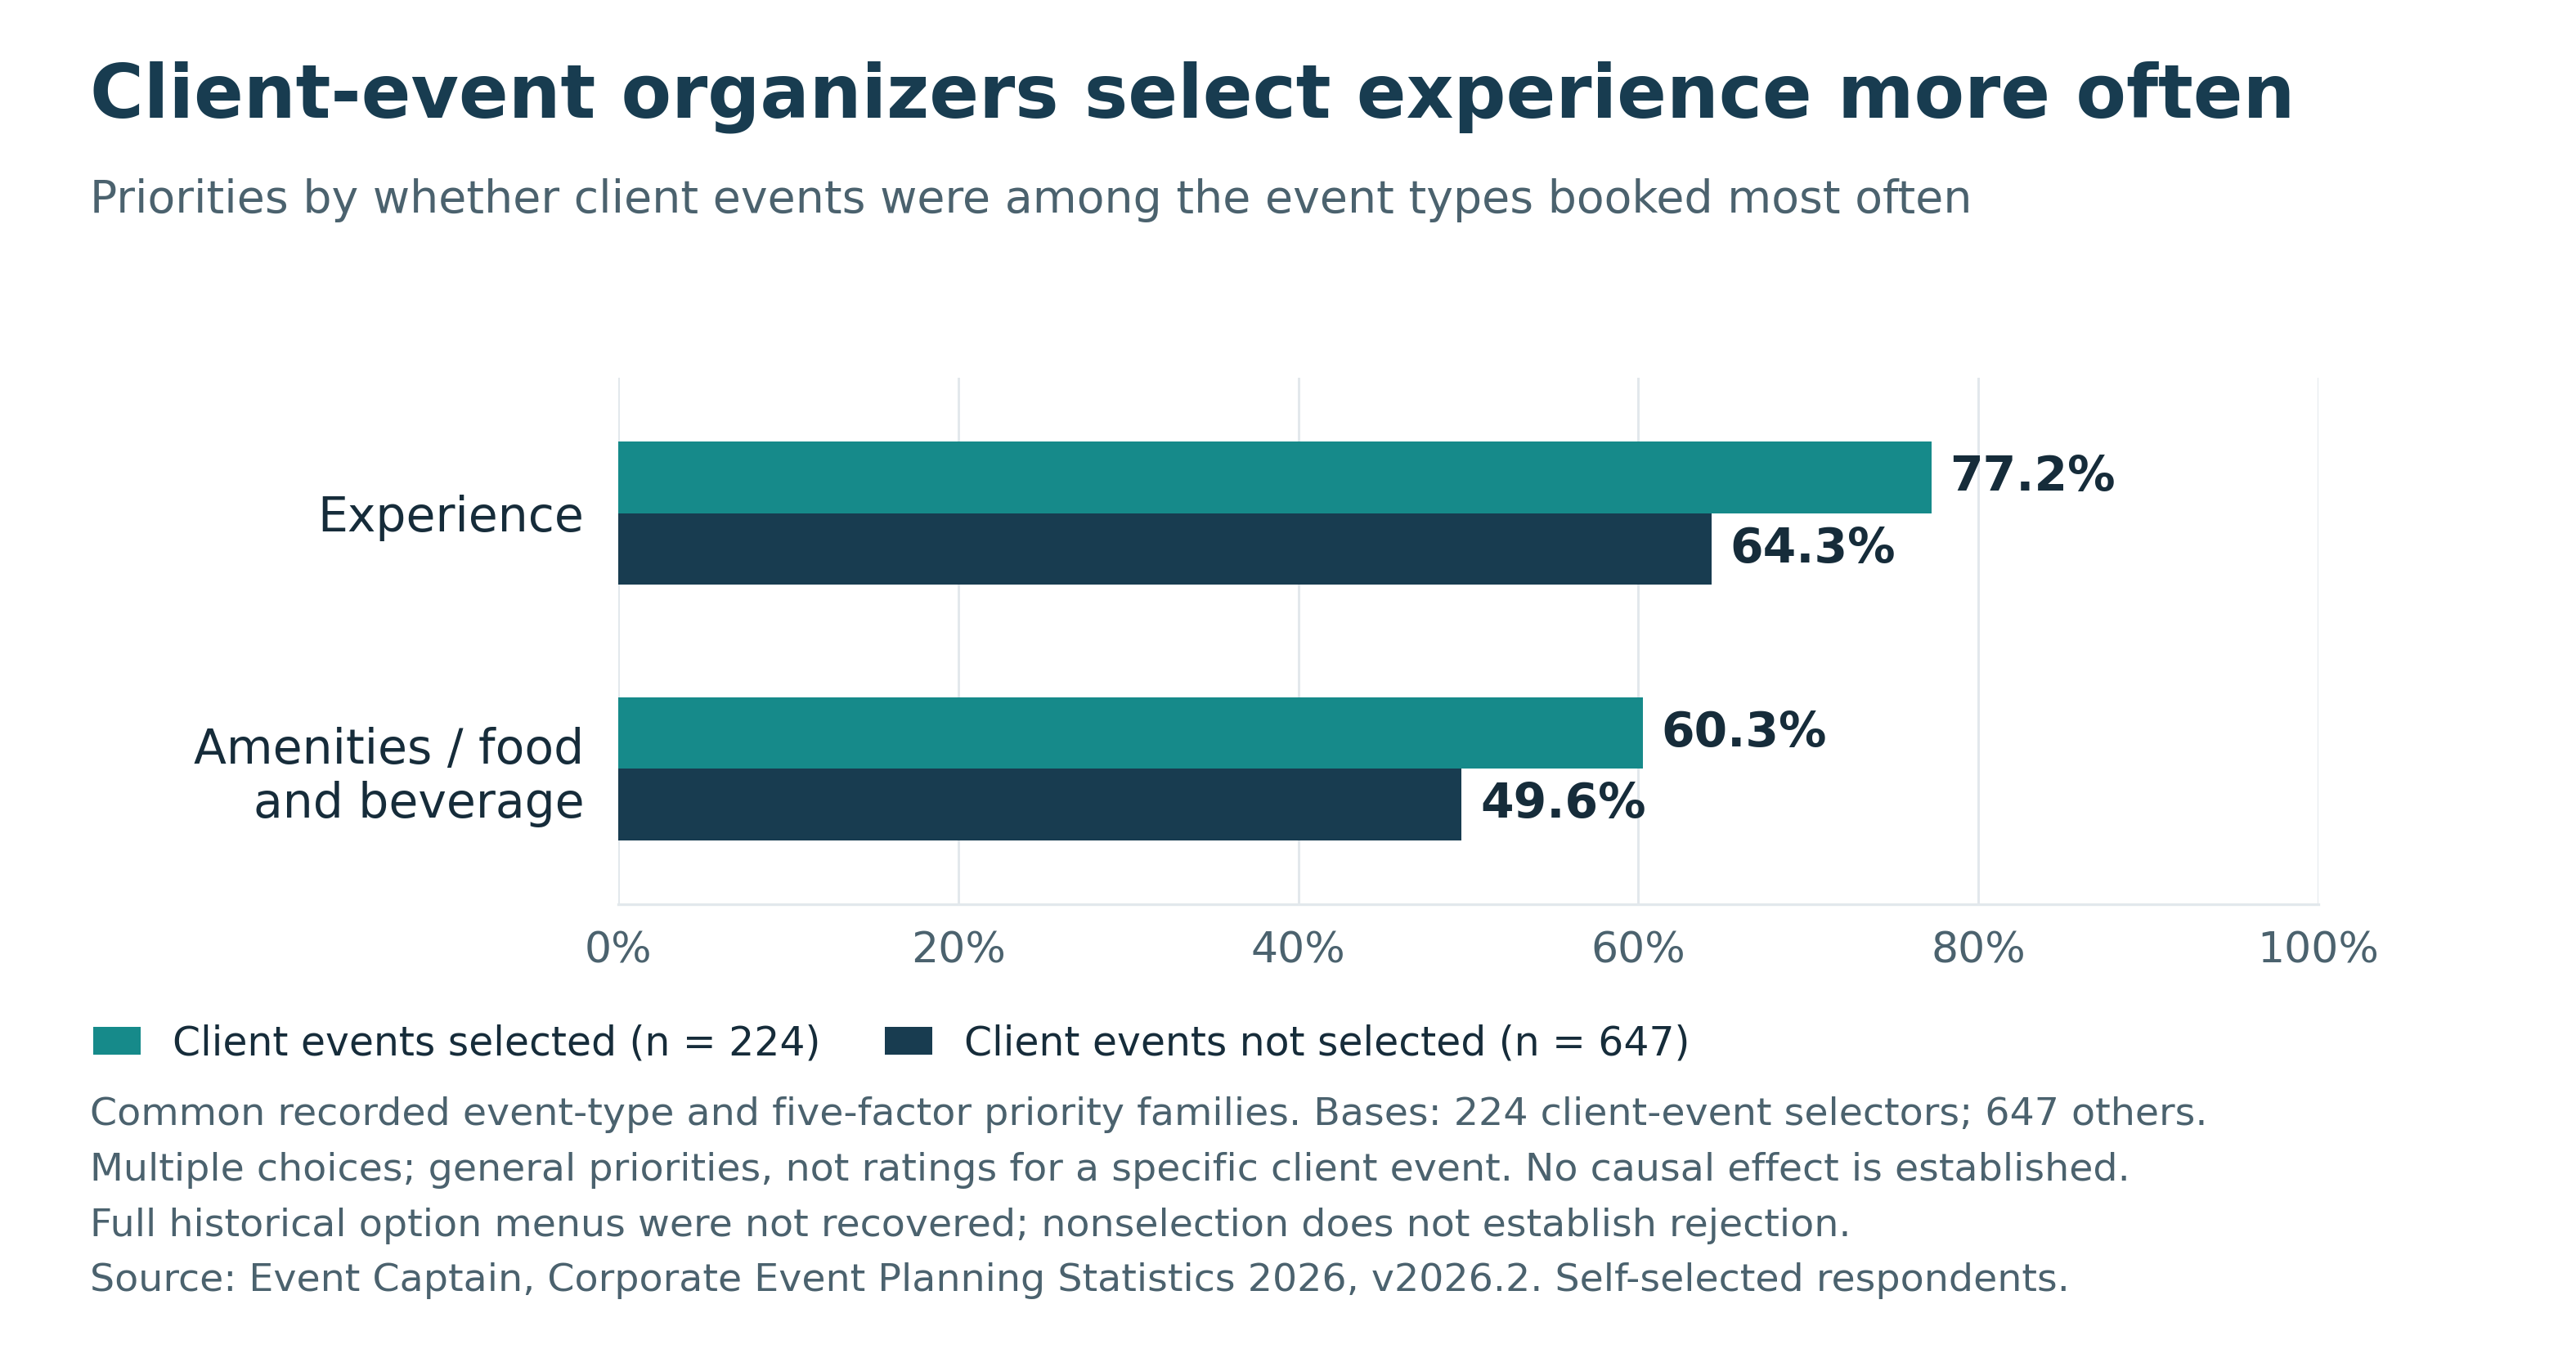
Client-event selectors: n = 224. Nonselectors: n = 647. Restricted to the common four-category event-type label family and the five-factor priority family. Both questions allow multiple selections. Groups combine similar answer options.
Source: Event Captain, Corporate Event Planning Statistics 2026, version 2026.2.
Supporting CSV includes full_confirmed and additional comparison cohorts.
| Priority selected | Client events selected | Client events not selected |
|---|---|---|
| Experience | 173/224 · 77.2% | 416/647 · 64.3% |
| Amenities/Food & Bev | 135/224 · 60.3% | 321/647 · 49.6% |
The event-type question asks which events respondents book most often. The two comparison groups are mutually exclusive; respondents in either group may also select other event types.
Food, beverage and amenities show a similar relationship: 60.3% versus 49.6%. These are the organizers’ general reported priorities, not ratings collected specifically for an individual client event.
For restaurants and venues, the implication is to test a client-hosting presentation that explains the food, service, setting and guest experience. The data supports a difference in emphasis between these organizer groups. It does not establish that experience outranks price for every client event.
Do the findings change after excluding Q4 venue-booking respondents?#
Among the 2,215 respondents with a usable quarter answer, we repeated the analysis after excluding anyone who selected Q4, including people who also selected other quarters. This left 1,113 organizers. The 17 qualifying organizers without usable quarter answers were excluded from both sides of this comparison.
| Finding | All respondents with quarter answers | No Q4 selection |
|---|---|---|
| Typical group size 1–20 | 59.2% · 1,193/2,016 | 59.5% · 605/1,017 |
| Booking lead time 1–3 months | 51.8% · 1,037/2,002 | 51.4% · 523/1,017 |
| All-inclusive packages selected | 58.3% · 586/1,005 | 55.3% · 297/537 |
| Recorded budget labels capped at $50 or less | 52.7% · 1,051/1,993 | 54.1% · 549/1,014 |
Question-specific bases vary. All-inclusive results remain within the price/ease/privacy family. All budget amounts are USD.
The main descriptive findings change little under this exclusion. The larger-group patterns also remain: 52.2% of the clearly 51+ group selected booking three months or more ahead, versus 11.1% of the 1–20 group; privacy was selected by 44.6% versus 16.7%, respectively. Larger-group bases are smaller in this check: 90 for lead time and 56 for privacy.
This is a sensitivity analysis of Q4 venue-booking selections. It is not a verified non-holiday-event sample.
What can restaurants and venues test based on these findings?#
The following are practical recommendations to test, rather than interventions whose sales impact was measured by the survey.
| Survey finding | Application for a venue |
|---|---|
| Small groups are common | Make 1–20-person options visible and explain group minimums and inclusions. |
| Larger-group organizers report earlier booking and select privacy more often | Begin larger-group conversations earlier and show the specific space and layout available. |
| Budget and experience are both frequently selected | Present a clear price together with a concrete description of the guest experience. |
| All-inclusive preferences correlate with budget-band selections | Ask about coordination needs and offer a clearly defined package. |
| Client-event selectors emphasize hospitality more often | Tailor the presentation around food, service, setting and guest experience. |
For practical package ideas based on these findings, see Corporate event packages: 8 lessons for restaurants and venues.
Methodology#
Population and recruitment#
Eligibility screening: the survey asks, “Do you plan or book events for your company or organization?” Other survey versions use equivalent wording. Event Captain confirmed on November 15, 2026 that this question appeared first and that a No answer prevented respondents from continuing. The analysis includes only affirmative respondents; responses without a usable Yes or with contradictory Yes/No answers were excluded.
Responses come from a survey of people who plan or book events for their company or organization. The primary sample contains 2,232 respondents who affirmatively reported planning or booking events for a company or organization and had no contradictory No answer. Results are reported only as aggregate counts. No respondent or venue is identified. Organizer status is self-reported; identity counts are based on survey responses rather than independent verification of individuals.
Self-selected survey respondents; some were offered a thank-you incentive. Results are unweighted, and no response rate is reported. The findings should not be generalized to all event planners, all countries or all corporate-event spending. Respondent geography was not independently verified.
Quality controls#
Duplicate and test responses were removed before analysis. Each person is counted once per question. If a person gave conflicting responses to a question, that question is excluded for that person; their other usable answers remain eligible. Missing answers are not counted as No or zero.
Dates and response formats#
Responses were collected during 2026; analysis completed November 14, 2026.
Some questions were worded slightly differently across survey versions; comparable answers were grouped together. Venue-priority analyses are kept within recorded answer families instead of pooling dissimilar options. A third, smaller priority family is available in the aggregate appendix but is not pooled into the main priority charts.
Multiple-selection questions count each respondent once per selected option and may total more than 100%. Each chart or table reports the actual answered base. Percentages are rounded to one decimal place; counts remain exact.
Grouping rules and interpretation#
The clearly 51+ attendance segment combines 51–100, 60–100, 101–250, 100+, 101–200, 251+ and 200+. Overlapping ranges such as 40–60 or 50–100 are excluded from the three-group comparisons. Booking windows of 3+ months, 3–6 months and 6+ months are combined as three months or more, with original labels preserved in the download.
Client-event comparisons retain the common recorded event-type family of team building/appreciation, client engagement/development, industry/networking and partnership events. Equivalent punctuation variants and one documented networking-label truncation are normalized. Broader alternative labels are kept out of that comparison. Event types are multiple selections, so an organizer can belong to more than one event-type group.
Budget ranges retain their original meaning; overlapping Under $75 answers are not allocated to narrower bands. The all-inclusive comparison uses the explicit per-person label format to preserve the above-$50 boundary. All monetary amounts are USD, confirmed by Event Captain on November 15, 2026. No currency conversions or exact mean budgets are calculated.
Subgroup comparisons are exploratory descriptive associations identified after examining several relationships. They are not causal effects or validated predictions, and no conventional probability-sample margin of error is reported. Venue mix, recruitment, answer formats and selection tendencies may contribute to observed differences.
Use the findings, charts and data#
The web edition provides a citation and data link for each core finding, plus PNG and SVG downloads for every chart. The core aggregate dataset contains 523 rows of counts, denominators, percentages and grouping definitions. A separate supplemental table documents the exact 1–20-person package-budget check. The codebook preserves the eligibility question and the recorded research questions.
The public downloads contain aggregate information only: no individual survey responses, names, email addresses, client identities or identifiable free-text responses.
This 2026 edition and its data should remain available when future editions are released. A separate research index can point to the latest edition. Changes over time should be reported only when question wording, response options and sampling information support a meaningful comparison.
Revision history#
Revision 2026.2.1, November 15, 2026: Methodology wording simplified; findings unchanged.
Revision 2026.2, November 15, 2026: Reorganized the report around reusable findings, added author and research-contact details, added chart-level citation and download tools, and documented the size-restricted package-budget check. The analytical sample, original 523 aggregate rows, counts and percentages are unchanged.
Revision 2026.1.2, November 15, 2026: Added the eligibility question and publisher-confirmed screening flow. All 2,232 included respondents answered Yes; counts and percentages are unchanged.
Revision 2026.1.1, November 15, 2026: Event Captain confirmed that all monetary amounts are USD. Methodology wording was simplified. Counts, percentages and the analytical sample are unchanged.
Use this research
You may quote these findings and reproduce Event Captain’s original charts with attribution and a link to the published report. Retain the year, respondent base and relevant notes.
Questions about the research or a specific data cut? Kevin Ho (kevin@eventcaptain.com).
Suggested report citation
Event Captain. Corporate Event Planning Statistics 2026: Budgets, Booking Timelines and Venue Preferences. 2026 edition, version 2026.2. Analysis snapshot November 14, 2026. https://www.eventcaptain.com/blog/corporate-event-planning-statistics-2026/
Download the supporting data
Aggregate results, question wording and definitions. No sign-up required.
Methodology reference: AAPOR Standards and Ethics. This reference informs transparency practices; it does not imply certification or endorsement.